許多開發者在遇到程式慢時,會憑「感覺」去優化程式碼。 「我覺得這裡迴圈太多了,改一下好了。」 「我覺得用這個函式比較慢…」
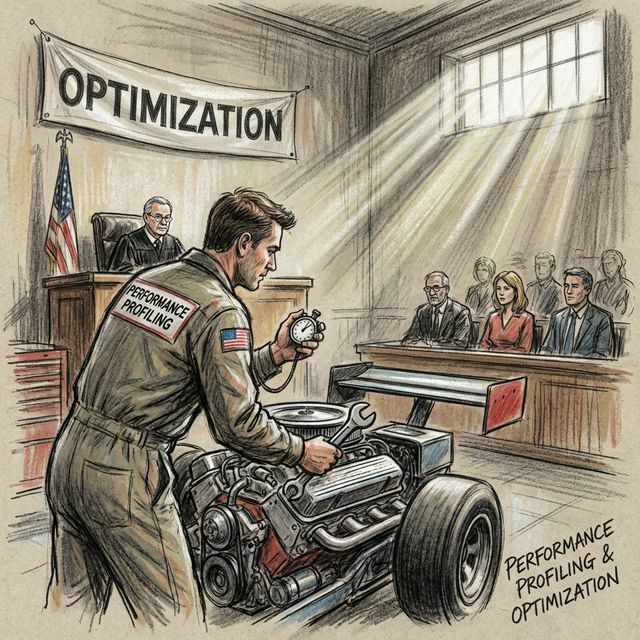
請停止猜測 (Stop Guessing)! 效能優化必須基於數據。Profiling (效能分析) 就是幫你的程式做全身健康檢查,精確指出哪一行程式碼或是哪一個函式拖慢了整體速度。
1. 內建 CPU 分析器:cProfile
Python 內建的 cProfile 是最常用的工具,它屬於 Deterministic Profiler,會記錄所有函式的呼叫次數與執行時間。
命令行使用
python -m cProfile -s tottime your_script.py
-s tottime: 依據 Total Time (總執行時間) 排序。
你會看到類似這樣的輸出:
   ncalls  tottime  percall  cumtime  percall filename:lineno(function)
        1    0.000    0.000    1.234    1.234 your_script.py:10(slow_func)
    10000    0.500    0.000    0.500    0.000 {method 'append' of 'list' objects}
- ncalls: 呼叫次數。
- tottime: 該函式本身的執行時間 (不含子函式)。這通常是你要優化的地方。
- cumtime: 該函式加上子函式的總時間。
程式碼中使用
import cProfile
import pstats

def my_slow_function():
    ...

with cProfile.Profile() as pr:
    my_slow_function()

stats = pstats.Stats(pr)
stats.sort_stats('tottime').print_stats(10) # 印出前 10 名
2. 記憶體分析器:memory_profiler
有時候程式不是慢,是吃爆了記憶體 (OOM, Out Of Memory)。memory_profiler 可以逐行分析記憶體使用量。
安裝:
pip install memory_profiler
使用方法
在你想分析的函式前加上 @profile 裝飾器 (不需要 import 任何東西,這是 memory_profiler 特有的魔術)。
# test_memory.py

@profile
def heavy_memory_func():
    a = [1] * (10 ** 6) # 約 8MB
    b = [2] * (2 * 10 ** 7) # 約 160MB
    del b
    return a

if __name__ == '__main__':
    heavy_memory_func()
執行時使用 mprof run 或直接用 python:
python -m memory_profiler test_memory.py
輸出結果:
Line #    Mem usage    Increment  Occurrences   Line Contents
=============================================================
     3     38.0 MiB     38.0 MiB           1   @profile
     4                                         def heavy_memory_func():
     5     45.7 MiB      7.6 MiB           1       a = [1] * (10 ** 6)
     6    198.3 MiB    152.6 MiB           1       b = [2] * (2 * 10 ** 7)
     7     45.7 MiB   -152.6 MiB           1       del b
     8     45.7 MiB      0.0 MiB           1       return a
你可以清楚看到哪一行程式碼瞬間吃掉了 152 MB 記憶體!
3. line_profiler:逐行時間分析
cProfile 只能看到函式層級,如果你想知道函式內部哪一行最慢,就要用 line_profiler。
安裝:pip install line_profiler
使用方式與 memory_profiler 類似,加 @profile 並用 kernprof -l -v your_script.py 執行。
4. 優化策略
找到瓶頸後,怎麼優化?
- 演算法優化:O(n^2) 改成 O(n) 或 O(log n)。(例如用
set查找代替list)。 - 資料結構選擇:用
deque代替list(如果你常在開頭插入),用ndarray代替迴圈。 - 快取 (Caching):使用
functools.lru_cache快取運算結果。 - 換工具:改用 C Extension (如 NumPy, Cython) 甚至 Rust。
5. Batch 7 總結
本批次我們深入探討了軟體工程的核心:
- Ch 31: SOLID 原則 (架構)
- Ch 32: Design Patterns II (模式)
- Ch 33: Pytest (測試)
- Ch 34: Logging & Debugging (除錯)
- Ch 35: Profiling (效能)
現在你的程式碼不僅僅是能跑,而且是結構良好、經過測試、容易除錯且效能優異的。
下一階段 Batch 8 (Advanced Testing & Deployment),我們將挑戰更困難的測試場景 (Mocking) 與自動化部署 (CI/CD)!(但首先,我們會把之前欠的圖片補上 😉)
延伸閱讀:


